RSO: Critique of Western Regional System Operator Assumptions and Assertions

v2-western-states-trimmed-only-rso-statesEvaluating the costs, benefits and impacts of a Regional System Operator (RSO) on states, utilities and customers is a complex process. The CA Independent System Operator (CAISO), as directed by the CA legislature, has performed significant analysis of these issues.  The body of work, known as the SB 350 studies, examined: creation and retention of jobs and other benefits to the CA economy, environmental impacts in CA and elsewhere, impacts in disadvantaged communities, emissions of greenhouse gases and other air pollutants, and reliability and integration of renewable energy resources.

The SB 350 studies were developed using independent consultants and an open, stakeholder process.  The studies provide credible, quantitative analysis on economic benefits of regionalization of the electric grid.  However, while robust, the studies do not quantify all possible benefits of an RSO, nor do they provide the individual state-by-state analysis that will be needed for state decision making outside of California. Study of net benefits for each involved state should begin immediately.

In addition to SB 350 study work, the CAISO is facilitating numerous initiatives to examine and design different facets of an RSO such as the planning process for adequate resources, how a new entity might be governed and how the system will pay for existing and new transmission. Through these processes, stakeholders have adopted many assumptions and have stated many assertions about future operation of an RSO.

As a supporter of regionalization Western Grid Group (WGG) has developed this paper to evaluate and respond to assertions about SB 350 studies and regionalization.  This paper is intended to be a living document that will be expanded and modified as regionalization proceeds. This paper covers eight topic areas:  cost of doing nothing; SB 350 study assumptions and findings, power plant emissions, consumer and system benefits, transmission, market manipulation, complexity of market operations, changes in jurisdictional authority as well as issues still being evaluated.

This paper is organized into two sections, organization of assertions by topic, followed by an in-depth response to each assertion. A bibliography of sources is also provided. Th­is document is intended to deepen the understanding of the effects of regionalization on the electric system in the Western Interconnection.

We welcome your input: rso at westerngrid.net.

  1. Cost of doing nothing or delaying

1.1   Doing nothing does not cost consumers money or cause higher emissions – Incorrect

1.2   There is no urgency to act, we can wait until 2024 before making a decision on an RSO. – Incorrect


  1. SB 350 study assumptions and findings

2.1     Studies do not quantify all benefits – Correct

2.2     RSO benefits are overstated because “current practice” should reflect more efficient bilateral markets in the future – Incorrect

2.3    RSO benefits are understated because SB 350 study assumptions understate the challenges of the Duck Curve — Correct

2.4    RSO benefits only occur when mistakenly assuming more renewables than required by state Renewable Portfolio or Energy Standards – Incorrect

2.5    Assumed solar costs are too high and lower solar costs diminish RSO benefits – Incorrect

2.6    SB 350 studies assume “free transmission” for out-of-state renewables – Incorrect

2.7    Mandated (doubling) energy efficiency wipes out RSO benefits – Incorrect

2.8    Most benefits to CA from regionalization are due to shifting CAISO costs to (PAC) and PAC wants a reduced Grid Management Charge (GMC) – Partially correct


  1. Power plant emissions

3.1    The SB 350 study findings show the regional energy market will increase greenhouse gas emissions – Incorrect

3.2   Regionalization will result in more natural gas burning in California and therefore more emissions of criteria air pollutants in disadvantaged communities – Generally Incorrect

3.3   Power plant startups (and associated emissions) increase with regionalization – Incorrect

3.4   An RSO will extend the life of existing coal plants outside CA – Incorrect

3.5   An RSO will not reduce Green House Gas (GHG) emissions because generators will re-dispatch dirty generation to non-CA consumers and sell their clean generation to CA consumers (“secondary dispatch”) – Incorrect

3.6   PAC will continue to run its coal plants because self-scheduling of generation and existing coal and power supply contracts will make the utility unresponsive to market prices – Probably Incorrect

3.7   Given PAC’s large coal fleet, the regional energy market will facilitate the transmission of more coal into California – Incorrect

3.8   PAC is the wrong utility for CAISO to partner with in an RSO because it will bring coal power into CA – Not necessarily right


  1. Consumer and system benefits

4.1   Consumers will never see the assumed benefits of an RSO – Probably Incorrect

4.2   The regionalization proposal is merely a resurrection of a plan from 20 years ago to expand CA’s power grid – Incorrect


  1. Transmission

5.1   PAC consumers will be forced to pay for transmission they don’t need such as Gateway West – Incorrect

5.2   CA is at risk of paying a significant share of new transmission facilities built in the PAC sub-region – Unlikely


  1. Market Manipulation

6.1   This regionalization proposal increases CA’s risk of having another electricity crisis – Incorrect


  1. Additional complexity and cost to grid operation and utility regulation from joining an RSO

7.1   If PAC joins an RSO the company will have to adapt practices to the complexities of regional market operation and that will add cost to consumers – Partially correct


  1. Change in Jurisdictional Authority

8.1   An RSO will impose CA policies on other states – Incorrect

8.2   An RSO will undermine CA’s ability to execute its clean energy policies – Incorrect

8.3   By approving a change in CAISO governance, CA gives up its power to set its own course before knowing whether an RSO will operate in its interest – Incorrect

8.4   An RSO enables FERC to expand its authority at the expense of state authority – Incorrect

8.5   Joining an RSO will remove significant costs from regulatory oversight – Incorrect

8.6   Public power and PMAs do not have an adequate role in an RSO – Incorrect


  1. Assertions still being evaluated:

9.1    Consumer and System Benefits – An RSO will raise rates in PAC states to levels in CA

9.2    Transmission – Because of limited transmission connectivity between PAC and the Independent System Operator (ISO), PAC will experience high congestion charges that offset the benefits of participating in an RSO

9.3    Transmission –  PAC joining an RSO will create problems such as impact on current power contracts and impacts on static transmission rights for non-RSO participants embedded in PAC’s system

9.4    Change in Jurisdictional Authority – CAISO’s stakeholder process is not appropriate for an RSO and needs improvement

1. Cost of Doing Nothing or Delaying

1.1    Doing nothing does not cost consumers money or cause higher emissions – Incorrect.

Doing nothing will result in:

  • Annual costs to CA in 2030 of $1,007-1,545 million which is equivalent to a 2-3% reduction in retail electricity rates (and by a lesser amount in every year leading up to 2030)
  • Lower levels of grid reliability
  • Higher than need be GHG emissions west-wide
  • Higher than need be GHG emissions to serve CA load
  • Higher than need be emissions in disadvantaged communities in CA
  • Fewer jobs in CA
  • Higher costs for consumers outside CA
  • Fewer options to achieve CA carbon policies at least cost to CA consumers
  • Perpetuation of high emissions power plants outside of CA
  • Perpetuate inefficient grid operations, even with the creation of an alternative to the RSO (e.g., Mountain West Transmission Group) as seams between markets will remain

1.2   There is no urgency to act, we can wait until 2024 before making a decision on an RSO – Incorrect. 

  • Delays in creating an RSO will lead to less than optimal resource addition decisions in CA, where utilities need to make investment decisions soon to achieve the 50% RPS mandate by 2030, and in non-CA states where the integration of lower cost wind and solar will likely lead to continued overbuilding and underutilization of natural gas power plants to accommodate changes in wind and solar output in each balancing authority area (BAA) (rather that accommodating lesser variability if BAA load and generation were aggregated).
  • Utilities in the West are evaluating the consolidation of grid operations, most notably the Mountain West Transmission Group (MWTG) which has issued an Request for Information for a tariff administrator and market operator. While consolidation of grid operations will lower costs, improve reliability and enable the integration of variable generation, the formation of more than one regional system operator in the western U.S. will inevitably create issues at locations where these operators abut.  Seams issues can be fairly intractable as has been seen with the seams between eastern Regional Transmission Organizations (RTO).  Two seams issues are of particularly concern:  continuing inability to address interconnection-wide loop flow that is limiting use of existing wires and reducing reliability; and new operational and market barriers that will inhibit flows of solar generation from east-to-west and west-to-east on a daily basis.  This will reduce the ability of CA to market surplus solar mid-day.

2. SB 350 Study Assumptions and Findings

2.1   Studies do not quantify all benefits – Correct.

SB 350 studies only quantify some benefits.  Public Interest Organizations (PIO) estimated the additional benefits of an RSO not evaluated in the SB 350 studies at $165 million in 2020 and $500 million in 2030.

PIOs identified the following additional benefits:

  1. Increased system reliability due to creating a larger Western market;
  2. Improved use of the physical capabilities of the existing grid both on constrained Western Electricity Coordinating Council (WECC) transmission paths and within the existing WECC balancing areas;
  3. Avoided construction of redundant transmission projects;
  4. Improved risk mitigation from a more diverse resource mix and larger integrated market;
  5. Competition-induced power plant efficiency and availability;
  6. Lower renewable integration costs for reasonably-expected non-RPS renewable power;
  7. Additional available transfer capacity due to coal retirements beyond Transmission Expansion Planning Policy Committee (TEPPC) 2024 assumptions;
  8. RSO-derived economies of scale in transmission construction to access distant renewables which would benefit consumers inside and outside CA;
  9. RSO-derived benefit of lowering cost of integrating new low carbon generation;
  10. Long term market benefits that extend beyond the SB 350 study time frames (2030);
  11. Regional unit commitment efficiency improvements that will occur due to the more efficient generation dispatch in non-market areas;
  12. Behavioral changes on the part of the Power Marketing Administrations (PMA) and consequent hydro efficiency improvements;
  13. The incremental benefits that would likely occur if non-participating Publically Owned Utilities (POU) in CA join the RSO;
  14. The impact of consultant-identified modeling shortcomings on RSO benefits;
  15. Reduced transaction costs that would accrue to CA customers in a regional market;
  16. The reliability benefits of more rapidly and efficiently forecasting and adjusting for abnormal weather and loads;
  17. The reliability benefits of RSO control that can more quickly and economically dispatch around an N-2 event than the current bilateral system;
  18. Frequency response procurement cost savings to comply with upcoming North American Electric Reliability Corporation (NERC) requirements; and
  19. Reduction in upstream methane emissions due to the lower gas burn with an RSO.


2.2   RSO benefits are overstated because “current practice” should reflect more efficient bilateral markets in the future – Incorrect.

Past efforts to improve efficiency of bilateral markets (e.g., Intra-hour Transaction Accelerator hour Transaction Accelerator Platform ) have failed. A different outcome is unlikely so long as utilities’ monopoly financial incentives remain in place and fragmented operation of the grid among 38 BAAs continues. For example, one financial incentive for utility monopolies is to exploit transmission limits and archaic operating practices to protect their equity earnings on capital investments in excess generation.

It is highly unlikely that bilateral markets can absorb 8,000 MW (plus 5,000-6,000 MW of re-export of current imports) of CA solar over-production given pancaked transmission rates and 38 fragmented BAs. CAISO ran a sensitivity assuming 8,000 MW of bilateral exports (RSO benefits are still big, $391-511 million annually).

Note that under the Clean Power Plan, should it emerge from its judicial stay, many western states are looking to coordinate their efforts to achieve least cost carbon reductions. This is consistent with pooling effects and efficient system-wide dispatch inherent in a regional market.


2.3   RSO benefits are understated because SB 350 study assumptions understate the challenges of the Duck Curve – Correct. 

The base assumptions in the SB 350 study assume several aggressive measures that minimize the ramping challenge CA faces from the deployment of large amounts of solar to meet its 50% RPS. For example, the study assumes:

  • Time-of-use rates that encourage daytime use
  • 5 million electric vehicles by 2030 with near-universal access to workplace charging
  • 500 MW pumped storage
  • 500 MW geothermal
  • Renewables provide operating reserves
  • Storage and hydro provide operating reserves and frequency response.


2.4   RSO benefits only occur when mistakenly assuming more renewables than required by state Renewable Portfolio or Energy Standards – Incorrect.

If 5,000 MW of “beyond RPS” renewables assumed in SB 350 studies are eliminated, annual WECC-wide production cost savings are $335 million in 2030 (instead of $980 million).  There is no reduction in annual CA procurement savings ($680-$799 million).  By contrast, Midcontinent ISO (MISO) and Electric Reliability Council of Texas (ERCOT) have experienced more “beyond RPS” renewables than assumed in SB 350 study (study assumed 2.6% of WECC sales from beyond RPS renewables in 2030; Mid-C beyond RPS renewables were 3% between 2011 and 2015, and ERCOT 6%)

In addition, new renewables are:  cost effective; being procured pursuant to corporate policies; likely to exceed some states’ minimum RPS standards; and more states, like Oregon and CA have done, could increase their RPSs.


2.5   Assumed solar costs are too high and lower solar costs diminish RSO benefits – Incorrect.

SB 350 study includes a $1 per watt sensitivity case. The study found that as solar penetration in CA increases, benefits of an RSO increase.


2.6   SB 350 studies assume “free transmission” for out-of-state renewables – Incorrect.

California pays for its proportionate share of assumed new transmission to move out-of-state renewables to California.


2.7   Mandated (doubling) energy efficiency wipes out RSO benefits – Incorrect.

Doubling efficiency (as required by SB 350) reduces benefits but an RSO still yields annual benefits to CA in 2030 of $576 million, compared with $692 million without mandated efficiency.


2.8   Most benefits to CA from regionalization are due to shifting CAISO costs to PAC and PAC wants a reduced GMC – Partially Correct. 

  • Correct in 2020.  $50 million cost shift from current CAISO participants to PAC
  • Incorrect in 2030 when CA benefits increase to $1,007- $1,545 million

As the resource mix within PAC and CAISO change due to new procurement and lower cost renewables, the benefits from an RSO will overwhelm any cost shift impacts.

3. Power plant emissions

 3.1  The SB 350 study findings show the regional energy market will increase GHGs – Incorrect.

The study shows that in 2020, there’s a potential for a fractional increase as the regional market just begins operating. That result stemmed from some limitations in modeling for individual generator characteristics and the use of a generic emission rate (combined cycle plant emissions) for imports into CA and lack of increase in renewable generation.

Additionally, the 2020 PAC-CAISO scenario fails to account for increased pressure on coal retirements from competition in the RSO market that will reveal costs for running coal plants (including hours when market prices are low or negative) that are not available in current bilateral market trading.  The SB 350 studies also fail to account for upstream methane emissions which would decrease as gas burn decreases under regionalization.

However, once the market is in full swing, there is a substantial carbon emission reduction in a regional market compared to the CA-only system. By 2030, as renewable development in CA increases to 50 percent under the regional market, the results show a carbon emissions reduction of 8 to 10 percent annually for CA, and 3.5 percent for the western states. The projected reduction for CA in 2030 is about 40 times that of the small increase in year one.


3.2  Regionalization will result in more natural gas burning in California and therefore more emissions of criteria air pollutants in disadvantaged communities – Generally Incorrect

The SB 350 studies show that emissions of NOx, PM2.5 and SO2 in 2030 are lower under the regionalization scenario than under the current practice scenario.  However, these findings are dependent on assumptions in the modeling.  Most of the assumptions are conservative and tend to understate emissions under current practice (e.g., assuming time-of-use rates that encourage daytime use, assuming 5 million electric vehicles by 2030 with near-universal access to workplace charging).  One assumption suggests that emissions in specific disadvantaged communities could increase slightly in the unlikely event that regionalization does not lead to the deployment of new renewables beyond those required by state mandates.  For example, in the sensitivity case with no additional wind beyond what is required by current RPS requirements, PM2.5 emissions in the San Joaquin Valley are 1.75% higher and SO2 emissions 1.8% higher than current practice.  There could be other conditions not modelled that might increase emissions in disadvantaged communities, such as a major west-wide carbon tax (higher than the $15/ton modeled).

There are potential policy solutions which could help ensure against increased emissions in disadvantaged communities such as capping emissions of specific natural gas plants located in proximity to disadvantaged communities.

The graphs below show SB 350 emissions results for 2030 in two areas – the San Joaquin Valley and the South Coast air basin.  The important comparisons in each of the graphs are between current practice (scenario  2030 CP1A) and —

  • Scenario 2030 1a_CO2, which assumes current practice plus a $15 west-wide carbon tax.
  • 2030 1b, which assumes a vastly improved bilateral market but no RSO. Given past failures to improve the efficiency of bi-lateral markets, achieving the efficiencies assumed in this scenario are unlikely.
  • 2030 R2, which assumes an RSO covering the western U.S. (except for BPA and WAPA and their customers) but no change in California renewable procurement policies.
  • 2030 R3, which assumes an RSO with California procuring lower cost renewable resources in the RSO region. However, this scenario conservatively assumes that the amount of renewables developed in excess of RPS requirements would be lower with a western RSO than what actually occurred in MISO and SPP.
  • 2030 R3 w/o Beyond RPS, which makes the unlikely assumption that regionalization will not lead to the deployment of new renewable beyond those required by RPS’s. This scenario is unlikely given the experience in MISO and SPP where a regional market led to the development of significantly more renewable that required by RPS.
  • 2030 R3_CO2, which assumes an RSO with a $15 west-wide carbon tax.

Note:  The NOx emissions shown in the next two graphs show both the emissions during the start-up of power plants (orange bar) and emissions during continuous operation of the power plant (blue bar).


Takeaways on NOx emissions in the San Joaquin Valley: 1) Current practice (2030CP1a) results in higher emissions than any RSO scenario (2030 R2, 2030R3, 2030R3 w/o Beyond RPS and 2030R3_CO2). 2) If bi-lateral markets are relied upon rather than an RSO (20301b), emission go up. 3) If a westwide carbon tax is applied without an RSO (2030 1a_CO2), emissions go up.


Takeaways on NOx emissions in South Coast: Like the San Joaquin Valley, NOx emissions are lower with an RSO that any other scenarios.

Takeaways on NOx emissions in South Coast: Like the San Joaquin Valley, NOx emissions are lower with an RSO that any other scenarios.


Takeaways on PM2.5 emissions in San Joaquin Valley: 1) Emissions in 2030 are lower with an RSO (2030 R3) than current practice (2030 CP1a), except when with the assumption that no renewables are developed beyond the existing 50% RPS (2030 R3 w/o Beyond RPS). In this scenario, emissions increase by 0.04 tons or 80 pounds per day. 2) If an RSO was formed and California purchased cheaper out-of-state renewable power (2030 R3), then emissions would drop by 0.18 or 360 pounds per day compared with current practice.

Takeaways on PM2.5 emissions in San Joaquin Valley:
1) Emissions in 2030 are lower with an RSO (2030 R3) than current practice (2030 CP1a), except when with the assumption that no renewables are developed beyond the existing 50% RPS (2030 R3 w/o Beyond RPS). In this scenario, emissions increase by 0.04 tons or 80 pounds per day.
2) If an RSO was formed and California purchased cheaper out-of-state renewable power (2030 R3), then emissions would drop by 0.18 or 360 pounds per day compared with current practice.


Takeaways on PM 2.5 emissions in South Coast: PM2.5 emissions in the South Coast are lower under all RSO scenarios than any scenario without an RSO.

Takeaways on PM 2.5 emissions in South Coast: PM2.5 emissions in the South Coast are lower under all RSO scenarios than any scenario without an RSO.


Takeaways on SO2 emissions in San Joaquin Valley: 1) Emissions are lower in all RSO scenarios than the scenarios without an RSO, except for the “2030 R3 w/o Beyond RPS” scenario where SO2 emissions increase by .004 tons per day or 8 pounds per day. 2)The San Joaquin Valley is not a non-attainment area for SO2.

Takeaways on SO2 emissions in San Joaquin Valley:
1) Emissions are lower in all RSO scenarios than the scenarios without an RSO, except for the “2030 R3 w/o Beyond RPS” scenario where SO2 emissions increase by .004 tons per day or 8 pounds per day.
2)The San Joaquin Valley is not a non-attainment area for SO2.


Takeaways for SO2 emission in South Coast: 1) Emissions are lower in all RSO scenarios than current practice and all scenarios without an RSO. 2) South Coast is not a non-attainment area for SO2.

Takeaways for SO2 emission in South Coast:
1) Emissions are lower in all RSO scenarios than current practice and all scenarios without an RSO.
2) South Coast is not a non-attainment area for SO2.

3.3   Power plant startups (and associated emissions) increase with regionalization – Incorrect. 

Plant startups decrease.  Plant startups are a major source of emissions from natural gas plants.


3.4   An RSO will extend the life of existing coal plants outside California – Incorrect.

  • Life extensions are a matter for state regulators to determine in dockets concerning rates, depreciation accounting, and planning for future resources. Nothing in RSO expansion changes state regulators’ control over life extensions.
  • The economics of PAC’s coal plants will be made more transparent in RSO operations, since they will either be bid into day ahead and real time markets, or, if self-scheduled, will be subsidized by PAC ratepayers to cover their above market costs. Transparent hourly market prices will enable easier calculations of hours when coal plant operation is uneconomic.
  • Since new wind has already been shown to be lower cost than running two PAC jointly-owned coal plants in Colorado, there is a good likelihood that other PAC coal plants will also be shown to be “out of the money” when compared to new wind. New solar prices, coming down fast, could also challenge old PAC coal plant on marginal operating costs, within the planning time frames in PAC’s current Integrated Resource Planning cycle, depending on assumptions about recycling PAC’s capital from old coal into new renewables, costs of refinancing undepreciated coal plant account balances, fuel costs and availability going forward, the Clean Power Plan and compliance options, and a host of other risks, costs and liabilities that face coal.


3.5    An RSO will not reduce GHG emissions because generators will re-dispatch dirty generation to non-CA consumers and sell their clean generation to CA consumers (“secondary dispatch”) – Incorrect.

  • Evidence from EIM operations shows that the export of surplus zero carbon emissions from CA overwhelms the emissions from re-dispatch of coal plants by EIM participants.
  • Transparent hourly prices provided by an RSO will demonstrate that many existing coal plants are not economic to operate.


3.6    PAC will continue to run its coal plants because self-scheduling of generation and existing coal and power supply contracts will make the utility unresponsive to market prices – Probably Incorrect.

  • PAC will be able to self-schedule its coal plants within an RSO (essentially require dispatch of the coal plants). Such self-scheduled plants are outside of the dispatch order set by market bids.  (Resources that self-schedule receive the market clearing price for every 15-minute period that they are dispatched, whatever that price turns out to be. If the market clearing price is less than the –fixed+variable – cost of operating the resource, it’s up to state regulators to determine whether the resource owner’s under-recovery of costs will be borne by ratepayers or shareholders.)  But with an RSO there will be transparent hourly prices against which a Public Utility Commission (PUC), or intervenors, will be able to point out the hours when PAC is dispatching its own plants which are being run at a higher operating cost than the market price.  A prudent regulator would not allow PAC to pass on this above market generation cost to ratepayers.
  • It is not known if existing PAC coal supply contracts require the company to accept delivery and pay for coal that is not needed for an uneconomic coal power plant.


3.7    Given PAC’s large coal fleet the regional energy market will facilitate the transmission of more coal into California – Incorrect.

Regional coordination will displace coal and carbon generation from PAC for the following reasons:

  • CA’s policy adds a fee to carbon coming into the state. The market is designed to dispatch the lowest total cost resource. This means that coal resources will be at a price disadvantage in the market, automatically reducing or eliminating coal from the market. Over time, that will decrease coal output, as the utility business model will not be sustainable. Less coal plant dispatch will tend to increase coal plant energy costs as less production is available over which to spread coal plant operating and capital costs.
  • Under the day-ahead regional energy market, when CA is experiencing oversupply situations, excess solar energy can be committed to meet customer demand in PAC’s states, which allows backing down or not even starting more expensive coal or gas generation. Likewise, when CA is experiencing peak electrical demand later in the day, it can tap into PAC’s large wind fleet to serve consumers.
  • There is evidence that this market structure already successfully displaces coal in the EIM. A 2015 report on coal use in the EIM shows that zero, or less than 1 percent of monthly energy supplies were generated from coal. Rather than increasing coal generation, a regional energy market with PAC’s full participation would result in coal generation being displaced by a more comprehensive optimization of renewable and transmission resources across a broad region and decrease emissions west-wide.


3.8    PAC is the wrong utility for CAISO to partner with in an RSO because it will bring coal power into California – Not necessarily Correct.

  • While other utilities could have cleaner resource portfolios and greater connectivity with the CAISO, PAC is the only utility to express interest thus far in partnering with CAISO to form an RSO. PAC’s participation will provide greater transparency into the dispatch of PAC’s coal fleet.  As more utilities join the RSO more efficient dispatch over a broad footprint will favor deployment of renewables.
  • PAC wants to join the ISO because it claims that it is committed to reducing its coal fleet and is already investing in various forms of renewable energy. In fact, because of the steps it has already taken, PAC’s carbon emissions in 2016 are approximately 18 percent lower than the average of its previous five years. It is expanding its portfolio of renewable resources, both directly and through power purchase agreements. However, it has been slow to retire its old coal fleet.
  • Here are more claims from PAC about its transition to clean energy: it is the second largest owner of wind generation assets among regulated utilities in the United States; renewable and non-carbon resources currently make up 25 percent of PAC’s owned and contract generation capacity; and within the next two years, PAC plans to add even more new wind and solar capacity via purchase power agreements with independent power producers.

Here are some facts about PAC’s portfolio: it has 34 megawatts of geothermal; 951 megawatts of contracted solar expected to come online by the end of 2017; more than 42 megawatts of customer solar generation in Pacific Power service area; and around 70 MW in Utah. PAC has partnered with dozens of developers to help deliver more solar generation to its customers. PAC is adding to its solar generation in Oregon with a contract for a new 5 MW facility in Bly, which will be the largest solar generation facility in the state. PAC supported efforts to create a 50 percent RPS goal in the state of Oregon.

Joining the ISO as a full participant will allow PAC to invest even more heavily in renewable energy. Using the ISO’s advanced dispatch increases the efficiency and cost competitiveness of renewables. Since three of the six states that would be joining the regional energy market already have an RPS policy, as a market participant, PAC would have an incentive to continue investing and expanding its portfolio of renewables across its entire service area.

4. Consumer and system benefits

4.1  Consumers will never see the assumed benefits of an RSO – Probably Incorrect.

  • We are starting to see Energy Imbalance Market (EIM) benefits realized in rate cases. Wyoming is addressing its Energy Cost Adjustment Mechanism (ECAM) as part of a current rate case and Utah is addressing the Energy Balancing Account (EBA) as part of a separate proceeding. Both of these proceedings address a fuel cost risk sharing mechanism (EBA in Utah; ECAM in WY). Because the utility is saving money through the EIM, it may owe ratepayers money. However, both of these proceedings are in progress and are not resolved.
  • Presumably as state regulators become more familiar with regional markets their assessment of rate requests from utilities will continue to be refined.


4.2   The regionalization proposal is merely a resurrection of a plan from 20 years ago to expand CA’s power grid – Incorrect.

Much has changed in energy over the past 20 years. Technological advancements, load growth, and billions of dollars in grid upgrades have brought us to the point that and RSO can use a state-of-the-art market platform to tap economies of scale to generate significant cost savings in producing and delivering energy.

This effort to evolve the ISO into an organization that can serve the West is being driven by a provision in SB 350 (2015) that requires CA to achieve a 50 percent renewable portfolio standard by 2030.

It is also being driven by western utilities’ need to integrate more renewables to meet their own state mandates for clean energy. In addition, the cost of building renewable resources is competitive with traditional forms of resources, which creates a strong business case for utilities to pursue renewables. Renewables are not only cleaner, but more cost-effective sources of energy. These major policy drivers are being experienced throughout the country and around the world.

5.  Transmission

5.1  PAC consumers will be forced to pay for transmission they don’t need such as Gateway West – Incorrect.

  • Under CAISO’s current Transmission Access Charge (TAC) proposal, the cost of existing transmission will remain with the respective utility or current CAISO customers and the cost of new transmission will be allocated to the parties who benefit from the new transmission. The current proposal also gives states authority to decide on cost allocations for new transmission, although CAISO will be obligated to offer to Federal Energy Regulatory Commission (FERC) a default cost allocation methodology in the event states do not agree.  Presumably, the default proposal methodology would mirror the current CAISO TEAM methodology which identifies benefits and beneficiaries of new transmission and assigns costs to beneficiaries, as FERC requires.  Of course, the TAC proposal has not yet been finalized and can change.
  • PAC has said that it will not seek to use a “transition agreement” with CAISO as a vehicle to grandfather Gateway project segments and thereby avoid scrutiny in the RSO’s integrated transmission planning process (TPP).


5.2   California is at risk of paying a significant share of new transmission facilities built in the PAC sub-region – Unlikely.

If the ISO forms an expanded balancing authority by integrating PAC, then each of the current areas would become a “sub-region” of the expanded “region.” Also, once the expanded balancing authority is formed, the ISO would initiate an integrated TPP for the entire expanded area. To begin consideration for “regional” cost allocation – cost allocation to multiple sub-regions – transmission facilities must be planned under the new integrated TPP.

For new facilities that meet this first requirement, the ISO will perform an assessment of the monetary value of economic benefits each of the sub-regions would receive from the facility. This means that in order for the current ISO area to be allocated any costs of a new transmission facility built in the PAC sub-region, the benefits assessment under the integrated TPP would have to demonstrate that the current ISO area receives economic benefits from the facility, and then the amount of cost that could be allocated to the current ISO area would be commensurate with its share of the economic benefits. Note that FERC Order 1000 requires that only the beneficiaries of a transmission project are obligated to pay for the project.

6. Market manipulation

6.1   This regionalization proposal increases CA’s risk of having another electricity crisis – Incorrect.

  • Unlike 2000-2001, FERC actively monitors markets for abuses and now has the statutory authority to levy fines up to $1,000,000 per day per violation and to order disgorgement of ill-gotten financial gains. FERC has been using its authority to discipline market manipulation and fraud (see orders against JP Morgan and others).
  • The California markets have been completely reworked and now have stringent safeguards to prevent the market manipulation that exacerbated the previous issue. In the past 16 years since the CA energy crisis, more transmission has been added to reduce congestion and generators must comply with strict rules to offer their energy into the market for resale. In addition, independent market monitors watch market participants and their bidding behaviors closely to detect attempts to circumvent the new strong rules or covertly game the market. Additionally, the CA PUC and other local regulatory authorities enforce resource adequacy rules that ensure sufficient capacity is made available to the ISO to meet load under a variety of conditions.

7. Additional complexity and cost to grid operation and utility regulation from joining an RSO

7.1    If PAC joins an RSO the company will have to adapt practices to the complexities of regional market operation and that will add cost to consumers – Partially Correct.

  • Participation in a regional market requires PAC to learn new terminology and market and transmission practices. However, PAC has made this transition once before when it joined the EIM. It has also upgraded its metering and communications to be compliant with regional market needs.
  • As experienced by Xcel, PAC should realize staff savings from participation in a RSO markets. Xcel, which has utilities that trade in two organized markets (MISO, Southwestern Power Pool) and in the Western Interconnection has found that participation in regional market operations reduces the need for highly experienced personal.  Presently, Xcel must use it most experienced personnel to manage its participation in western bilateral markets and it can use its least experienced personnel to participate in MISO markets.
  • PAC should also achieve savings from no longer assuming legal and operational obligations of a Balancing Authority under NERC reliability rules. These will be assumed by the RSO.
  • State regulators outside of CA will need to invest staff time to learn the organized markets an RSO operates. However, PAC’s regulators already need to improve their knowledge of market operations as a result of PAC’s participation in the EIM.

8. Change in jurisdictional authority

8.1    An RSO will impose CA policies on other states – Incorrect.

An RSO will be charged with operating the transmission system of a regional market. It will not dictate policies for other states. CA will be able to continue dictating policies for CA and UT will be able to continue dictating policies for UT. The RSO will be governed by an independent Board of Directors and will be advised by a Western States Committee (WSC) – a body of state appointees from the expanded RSO footprint that will advise the RSO Board on an on-going basis.

CAISO’s latest governance proposal (October, 2016) suggests a WIRAB-like voting model for issues within the primary authority of the WSC, requiring 75% of the states (i.e., the voting members of the WSC) plus 75% of the load. For an expanded RSO that includes current CAISO participants as well as PacifiCorp the Net Energy for Load (NEL) data from the North American Electric Reliability Corporation and the U.S. Energy Information Administration, load percentages are as followed:  California – 81%, Utah – 8%, Oregon – 5%, Wyoming 3%, Washington – 1%, Idaho – 1% and Nevada – <1%.

Using these percentages, California will hold veto power over the WSC in the sense that nothing will “pass” unless it receives approval from California. Even if every other state on the WSC voted “yes,” if California votes “no,” the decision will not hold given California’s load dominance. However, other states hold power in the sense that California cannot pass anything on behalf of the WSC on its own. If California votes “yes,” it would still need five other states to vote “yes” in order for the decision to hold. In this sense, the voting model does encourage consensus among members of the WSC.


8.2    An RSO will undermine CA’s ability to execute its clean energy policies – Incorrect.

See answer to question above. The bottom line is that an RSO will be charged with effectively and efficiently operating a regional grid. It will not be charged with enforcing any state policies and it certainly won’t be charged with favoring one state’s policies over another’s. While state policies may influence future resource procurement decisions and the need for new transmission (which may impact the RSO), the RSO itself will not influence any one state’s policies.


8.3   By approving a change in CAISO governance, CA gives up its power to set its own course before knowing whether an RSO will operate in its interest – Incorrect. 

  • With or without an RSO, CA (and any other state) will continue to have the same authority it has today to approve rates and utility investments.
  • Additionally, the CA PUC, like all PAC state PUCs, can reject PAC’s transfer of control of assets to the RSO.
  • Because of the challenges inherent in the Duck Curve, CA needs to move forward with regionalization, with or without a firm commitment from PAC.


8.4    An RSO enables FERC to expand its authority at the expense of state authority – Incorrect.

The ISO is already under FERC’s jurisdiction, and that would not change with a regional energy market. The ISO would also continue to remain subject to the grid standards established by the NERC and its reliability coordinator, the WECC. Under a regional grid, legislatures, the Public Utilities Commissions, and local regulatory bodies will continue to maintain the authority and ability to dictate procurement decisions over the state’s utilities as it does today.

Additionally, CAISO’s revised governance proposal includes binding provisions to protect and preserve state authority. This will include the preservation of state authority over resource procurement policy and resource planning, retail ratemaking, Certificates of Public Convenience & Necessity (CPCNs) approvals for utilities within their jurisdiction, and resource or transmission siting within their state.


8.5   Joining an RSO will remove significant costs from regulatory oversight – Incorrect.

If states do not already provide regulatory oversight concerning fuel and purchased power, and rate mechanisms that carry such costs into consumers’ rates, they should do so.  Most commissions have authority to audit utility books of accounts and to disallow any costs that are not prudent, reasonable, or that do not represent costs that are “used and useful” for providing consumer service.

In proceedings to allow utility assets to be transferred into RSO control, state commissions have the opportunity and authority to condition their approval on steps to require full disclosure of costs and appropriate rate treatment.  There is no reason that state regulators should allow any utility costs to be removed from their oversight and regulatory authority.


8.6   Public power and PMAs do not have an adequate role in an RSO – Incorrect.

CAISO is envisioning a seat at the table on the Western States Committee for both publicly-owned utilities (POUs) power and federal Power Marketing Administrations (PMAs) (e.g., BPA, WAPA). This would be a non-voting advisory role. In response to requests from both public power and federal PMAs, CAISO’s latest governance proposal provides for two seats for public power and one seat for a federal PMA on the Western States Committee. CAISO included two seats for POUs due to the stakeholder concerns that the number, size and diversity of POUs across the region warranted having two non-voting representatives. While these are non-voting roles, they offer POUs and PMAs a seat at the table and the important opportunity to participate in deliberations of the WSC. See: CAISO’s latest governance proposal.

The WSC is comprised of state officials, most likely Commissioners from the state PUCs that regulate Investor Owned Utilities (IOU).  Unlike IOUs, POUs and PMAs are not regulated by a state PUC and so it is appropriate for them to have their own representation on the WSC.  The seats are non-voting because it would be inappropriate to have a direct market participant like a POU voting on market issues.  Similarly, there are likely legal issues with a PMA, which is an agency of the US DOE, voting on issues that are ultimately decided by FERC, a sister federal agency under DOE.

Also, there’s the potential for membership of both types of entities in a future Member Advisory Committee (a formal stakeholder group to advise the future RSO board). The structure of the RSO’s future stakeholder process will be determined by the Transitional Committee of Stakeholders, of which both POUs and PMAs will be a member.

9. Assertions still being evaluated

9.1    Consumer and System Benefits – An RSO will raise rates in PAC states to levels in California.

9.2    Transmission – Because of limited transmission connectivity between PAC and the Independent System Operator (ISO), PAC will experience high congestion charges that offset the benefits of participating in an RSO.

9.3    Transmission –  PAC joining an RSO will create problems such as impact on current power contracts and impacts on static transmission rights for non-RSO participants embedded in PAC’s system.

9.4    Change in Jurisdictional Authority – CAISO’s stakeholder process is not appropriate for an RSO and needs improvement.

This is being addressed as part of the governance stakeholder process. CAISO is open to considering a more formal stakeholder process for the RSO and has indicated as much in the latest version of its governance proposal. Ultimately, the specifics of a future stakeholder process for the RSO will be decided by the Transitional Committee of Stakeholders.

The Transitional Committee will be comprised of one representative from each of the states in the expanded RSO footprint and one representative from each of the following sectors: (1) Investor-Owned Utilities, (2) Publicly-Owned Utilities, (3) Independent Power Producers (including Generators & Marketers), (4) Large Scale Renewable Energy Providers, (5) Distributed Energy Resource Providers, (6) Federal Power Marketing Administrations, (7) Public Interest Groups, and (8) End-Use Consumer Advocate Groups. Besides clarifying the RSO’s stakeholder process, the Transitional Committee will also be charged with finalizing certain governance principles for the future RSO.

The experience with extensive stakeholder committee structures at WECC and other RTOs has not been good.  Such processes are slow and dominated by parties (e.g., utilities) which have the staff to cover innumerable meetings over a long period of time.

Comparably speaking, the CAISO stakeholder process for to developing an RSO has been much more transparent to date than the process that has been used to develop the Mountain West Transmission Group (MWTG) proposal.  For example, to date, MWTG has not provided any opportunities for stakeholder participation, whereas CAISO has developed a stakeholder process focused on specific issues germane to regionalization (e.g., Transmission Access Charge, Resource Adequacy, SB 350 Studies, GHG Accounting & Tracking, and Governance), seeking stakeholder input throughout the process.

Bibliography

2.1  Bullet #19: 

“Clean Energy and Pollution Reduction Act Senate Bill SB350 Study”, a report of the California Independent System Operator (CAISO), July 12, 2016; pages 17 & 91.

See: http://www.caiso.com/Documents/SB350Study-StakeholderComments-ISOResponses-May24-25_2016.pdf


2.2  Bilateral markets:

“Senate Bill 350 Study: The Impacts of a Regional ISO-Operated Power Market on California”, an aggregated report of the CAISO, July 8, 2016; Volume 3, p. 9 & Volume 5, pp. 61-64.

See: http://www.caiso.com/Documents/SB350Study_AggregatedReport.pdf


2.3  Storage and hydro

“SB 350 Study: The Impacts of a Regional ISO-Operated Power Market on California Analysis and Results”, a presentation to the Joint State Agency Workshop on the Proposed Regionalization of the Independent System Operator, Sacramento, CA; The Brattle Group, Energy and Environmental Economics, Inc., Berkeley Economic Advising and Research, LLC, and Aspen Environmental Group; July 26, 2016; slide 21.

See: https://www.caiso.com/Documents/Presentation-SenateBill350Study-Jul26_2016.pdf


2.4  RPS requirements

“SB 350 Study: The Impacts of a Regional ISO-Operated Power Market on California Analysis and Results”, a presentation to the Joint State Agency Workshop on the Proposed Regionalization of the Independent System Operator, Sacramento, CA; The Brattle Group, Energy and Environmental Economics, Inc., Berkeley Economic Advising and Research, LLC, and Aspen Environmental Group; July 26, 2016; slides 13, 36, and 129-138.

See: https://www.caiso.com/Documents/Presentation-SenateBill350Study-Jul26_2016.pdf


2.5  Assumed solar costs

“SB 350 Study: The Impacts of a Regional ISO-Operated Power Market on California Analysis and Results”, a presentation to the Joint State Agency Workshop on the Proposed Regionalization of the Independent System Operator, Sacramento, CA; The Brattle Group, Energy and Environmental Economics, Inc., Berkeley Economic Advising and Research, LLC, and Aspen Environmental Group; July 26, 2016; slide 30.

See: https://www.caiso.com/Documents/Presentation-SenateBill350Study-Jul26_2016.pdf


2.6  “Free transmission”

“Clean Energy and Pollution Reduction Act Senate Bill SB350 Study: Stakeholder Comment and ISO Responses from May 24 – 25, 2016 Preliminary Results Meeting”, a report of the CAISO, July 12, 2016; p. 30.

See: http://www.caiso.com/Documents/SB350Study-StakeholderComments-ISOResponses-May24-25_2016.pdf; and


“SB 350 Study: The Impacts of a Regional ISO-Operated Power Market on California Analysis and Results”, a presentation to the Joint State Agency Workshop on the Proposed Regionalization of the Independent System Operator, Sacramento, CA; The Brattle Group, Energy and Environmental Economics, Inc., Berkeley Economic Advising and Research, LLC, and Aspen Environmental Group; July 26, 2016; slide 108.

See: https://www.caiso.com/Documents/Presentation-SenateBill350Study-Jul26_2016.pdf


2.7  Mandated energy efficiency

“SB 350 Study: The Impacts of a Regional ISO-Operated Power Market on California Analysis and Results”, a presentation to the Joint State Agency Workshop on the Proposed Regionalization of the Independent System Operator, Sacramento, CA; The Brattle Group, Energy and Environmental Economics, Inc., Berkeley Economic Advising and Research, LLC, and Aspen Environmental Group; July 26, 2016; slide 28.

See: https://www.caiso.com/Documents/Presentation-SenateBill350Study-Jul26_2016.pdf


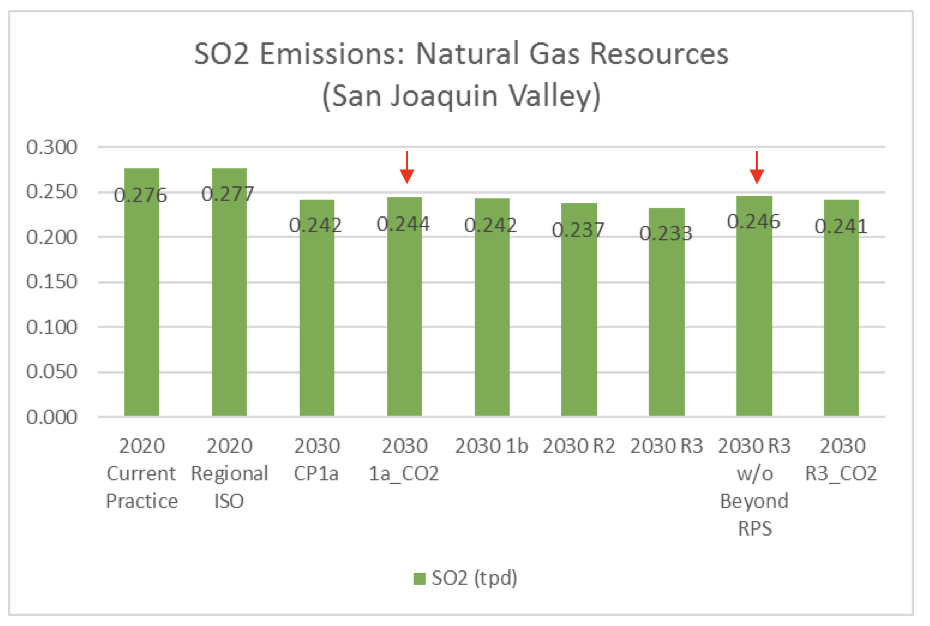
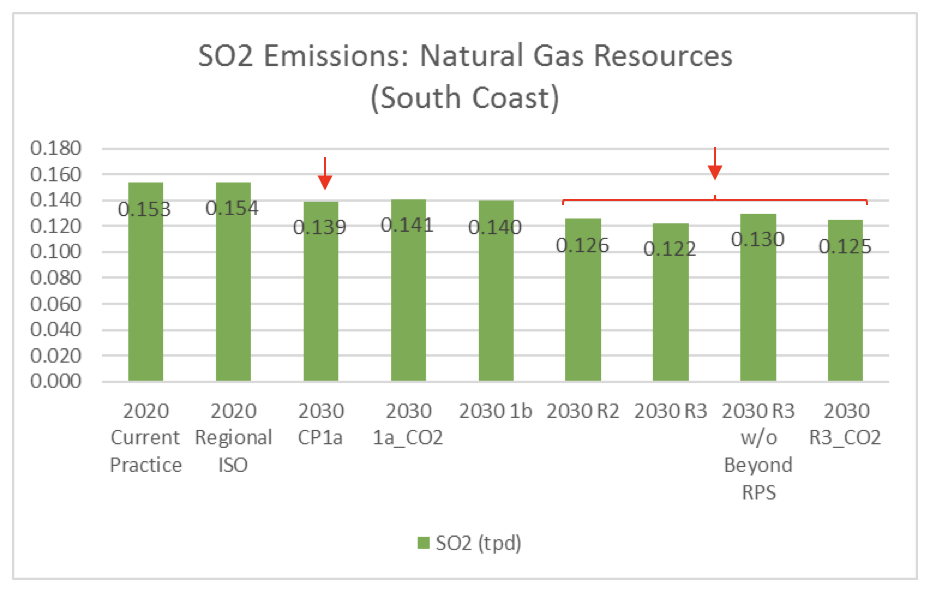
3.2  Gas burning in disadvantaged communities

“Senate Bill 350 Study: The Impacts of a Regional ISO-Operated Power Market on California”, an aggregated report of the CAISO, July 8, 2016; Volume 10, pp. 31-32.

See: http://www.caiso.com/Documents/SB350Study_AggregatedReport.pdf


3.5  GHG emissions

“Energy Imbalance Market: GHG Counter-Factual Comparison (Preliminary Results: January-June 2016)”, a report of the CAISO, August 25, 2016; slides 3-4.

See: https://www.caiso.com/Documents/EIMGreenhouseGasCounter-FactualComparison-PreliminaryResults_Jan-Jun_2016_.pdf


3.7  Transmission of more coal

“2015 Annual Report on Market Issues & Performance”, a report of the CAISO, May 2016, p. 41.

See: http://www.caiso.com/Documents/2015AnnualReportonMarketIssuesandPerformance.pdf


9.4  Latest governance proposal

Revised Proposal: Principles for Governance of a Regional ISO”, a report of the CAISO, July 15, 2016.

See: https://www.caiso.com/Documents/RevisedProposedPrinciples-RegionalISOGovernance.pdf